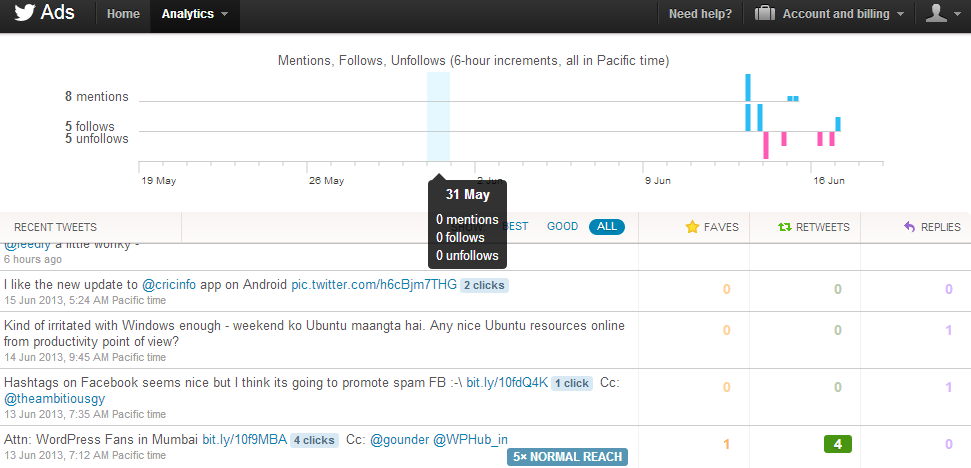
Twitter has opened up analytic data to all users. This data was previously only available to advertisers. The analytic dashboard will show up stats on retweets, replies, favorites for every tweet you publish. The analytics dashboard also displays how many people are unfollwing your account.
How to use Twitter Analytics!
- Visit the URL ads.twitter.com and sign-in with your Twitter credentials. The first page will show you the option to advertise. At the top left corner on the page, we can see an option to look up “Analytics”.
- The analytics data is very basic and the graph shows a 6 hour increment. You might want to check some interesting details like at what time of the day your tweets get maximum engagement or what kind of tweets have a maximum impact.
- I saw there is also a “Follower” option on the analytics dashboard. But when I used it on my account, it showed there was not enough data to display. I guess this could be because I do not have like thousands of followers. But the follower analytics displayed is supposed to be based on location, gender and interests.
The basic idea behind all this is for Twitter to make it lucrative for users to spend more on advertising on Twitter. The data by no means is all the data that is made available to advertisers but it is good enough to spend some time over and get ideas for maximizing your impact on Twitter.
Link: Twitter Analytics
Related: Find the best time to schedule a tweet.


You must be logged in to post a comment.