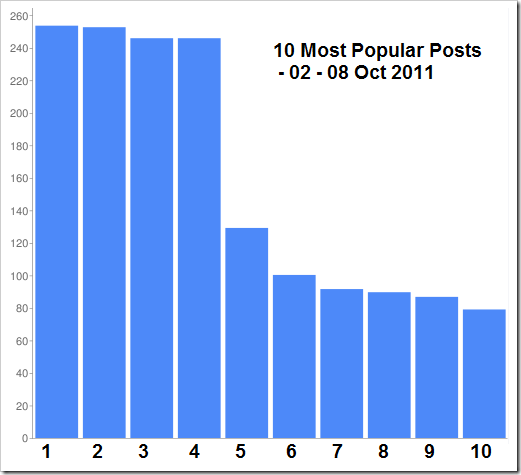
This week was sombre for anyone who followed technology. Steve Jobs passed away on 5th October. I can only marvel at his impact, as so many young people who are self-employed or starting a business, have been suggesting Steve Jobs as an inspiration for so many years.
Hence it is no surprise that two posts on Steve Jobs, feature among the most popular this week.
10 Most Popular Post This Week!
- SpeakAsia Scam – Surveys Lifted from Wikipedia
- 15 Inspirational quotes by Steve Jobs
- Best privacy settings for your New Facebook profile
- Facebook sued again for tracking logged out users
- Apple iPhone 4S; features and specifications
- 5 Biggest Threats to Aakash Tablet’s Success!
- Top 10 Losers And Gainers Google Rolls Out Panda 2.5 Update
- Google Shuts Public Access to Page Ranks
- RIP Steve Jobs [1955-2011]
- Facebook’s new Public Metric “People Talking About This”
Which one is your favourite post from the list? DO drop in your comments.

5 Comments
I have a question since a few weeks. What is the on Y-axis. Is it number previews for that week or else?
I am surprised people didn’t know that speakasia surveys are lifted from Wikipedia! It’s actually Wikipedia+eHow+some other similar sites. The most intresting part, Speakasia pays 30,000 – 1,50,000 for designing a survey (actually scrapping content).
One more thing it’s not their fault. They have mentioned everything at the footer of the some what called EZine magazine.
@Anand: : Y Axis is actually reactions we get from Facebook, Twitter and G+. Each is given importance differently. We do round up the number and I guess some posts posted towards the end of the week get less value than the ones right at the beginning.
I had never subscribed to the Ezine from SpeakAsia so did not know but I guess this piece of news was confirmation.
That’s why i thought, why speakasia is still at number 1!
I have seen some surveys since some of my friend were (we may say this now) a speakasia panelist, so i can confirm this.
What does the numbers in the graph represent.
@Dinesh: It is a total of all the approximate values assinged to sharing on FB, G+ and Twitter. For examply a FB share equals 10 points, G+ 8 and Twitter = 9 points. Idea was to give a clearer view of how the posts from a particular week were popular.