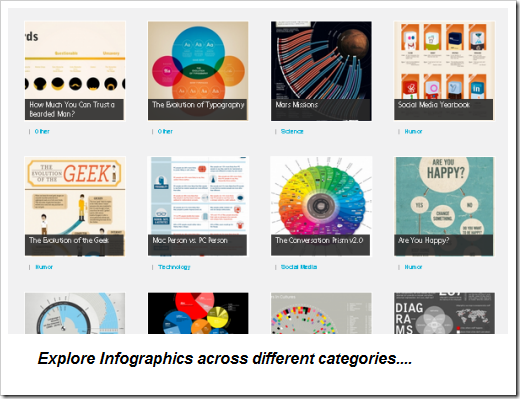
 Data can be visualised and understood a lot better when an infographic of it is presented. A infographic is basically a large poster like image, which presents data in a flow. Most people can learn a lot more from a infographic within minutes compared to reading about it.
If you are a web artist and have a penchant for checking out infographics or even creating them, then Visual.ly is a neat service.
Visual.ly Features
- I could skim through several categories and look up relevant infographics or simply search on a topic. When you look up an infographic, it shows who created the infographic and where it was published.
- If you register with an account, users can also register their work with Visual.ly. This could be a great way to drive traffic to your website or blog.
I liked the fact, that people who painstakingly create infographics have a single directory to share their work. It can also help reach out to the highest possible audience.
Here is a video presentation on Visually.
Do look up Visually and drop in your comments.
Link: Visual.ly Infographics

