 When I was in school, my teacher would advise me always to make a diagram or flowchart of things I learnt, so I could understand and retain more. Making diagrams and charts is a great way to explain to your readers new ideas, trends and concepts emerging out of data.
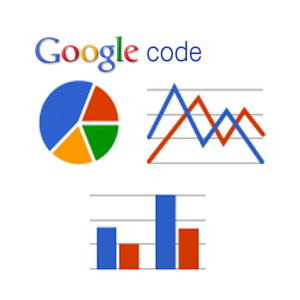
Webmasters can create complex graphical charts and then embed them into their website by using Google Charts. It is a product on Google Code and basically useful to create charts from databases or data from Google Docs.
Using Google Image Chart Editor
- Just look up Image Chart Editor and view a host of different chart types you can select from.
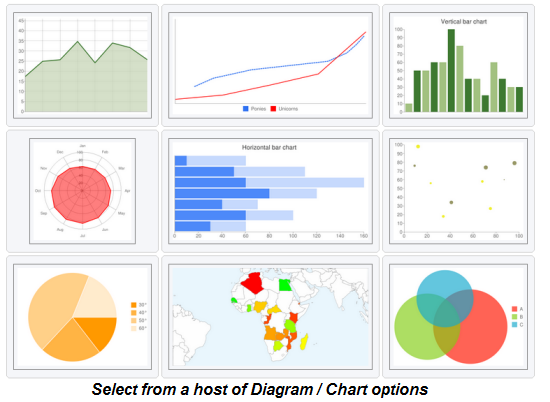
- Along with different types of charts, there is also the option of creating new charts from ground up. This gives a great amount of flexibility.
- Once done, you can tweak the HTML code if you want, which can then be copied and entered on your website, so visitors can enjoy the diagram charts on your website.

Go ahead and create new beautiful charts on Google Charts and embed them on your website with Google Image Chart Editor. You might also want to check out Lovely Charts, a service to create and share flowcharts.
Do drop in your comments.
You must be logged in to post a comment.